


Funnel Hacks for Busy Sponsors Part 1: Top of the Funnel
Campaign health in the fewest data points possible

Funnels are funny.
When you’re running a patient recruitment campaign, a funnel is pretty much a mandatory deliverable. But honestly, no one seems to really like them.
From my perspective, the main problem with funnels is that they are under-informative. They’re slightly useful at the beginning of enrollment to make sure everyone understands what the plan is – and then they’re not super useful until the very end of enrollment when you want to assess how it all went. To actually manage and improve an outreach campaign, you need way more data than what a funnel can give you.
But that’s the perspective of someone whose full-time job is to think about enrollment.1 For many normal less fortunate people, a funnel presents as TMI. It’s just a lot of layers of numbers, and it’s simply hard to interpret if they’re plausible – even harder when you’re in the middle of enrollment and the data’s coming in over time.
So, how do we hack the funnel?
By “hack” here I mean specifically: a metric that’s both easy to obtain and generally useful. It is the opposite of the perfect precision measurement – it has clear limitations but still does a pretty good job of getting you a decent read on the situation. For example, in healthcare, BMI is a hack. It lacks nuance2 and there are many objectively better measures, but it is really easy to obtain and still does a surprisingly decent job of predicting health risks.
The challenge here is to distill the whole patient recruitment funnel down into a couple of easy metrics. These don’t need to be perfect, but need to get the job done well enough, most of the time.
And in this case, I think there are two numbers that manage to be effective hacks. They’ll illuminate much of what’s working (or not) in a recruitment campaign with a minimum of effort. They break the campaign into two key components:
Campaign performance at the top of the funnel – how we’re directly engaging potential participants
Site performance at the bottom of the funnel – how pre-qualified leads are handed off and brought into the trial
In this post I’ll cover the first hack, covering campaign performance. In Part 2 I’ll discuss site performance.
Top of the funnel: Cost per Inquiry
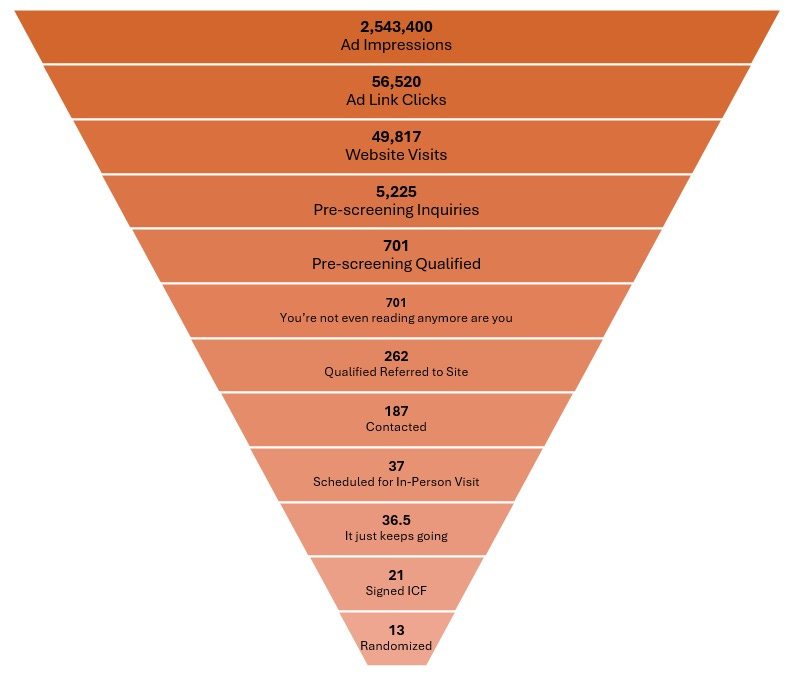
An “inquiry” is anyone who has arrived at your website and started the qualification process by answering at least one question on your pre-screening form. This is the minimum unit of potential interest in the trial. A person has seen and clicked through a link or ad and then clicked the “see if you qualify” link. And in a very real sense, this is the fundamental thing you want your outreach to accomplish.
So, cost per inquiry (CPI) – the dollars you spend per pre-screener start - is a solid proxy for your efficiency at engaging the audience you want to engage. It has a lot of nice features:
(Close to) real time feedback: the CPI mostly won’t be very volatile. You should be able to see where it is – and if it’s on track with prediction – within just a couple days.
Less “gameable” than up-funnel metrics: the standard digital ad metric of cost per click is extremely easy to manipulate. Anyone can flood your website with low-cost traffic, but most of that effect will wash out when that traffic doesn’t engage with the qualification process.
Reflective of ongoing improvements: in the hands of a competent media team, CPI will generally trend downward over time. You should be able to see this trend and rely on it as a sign that the recruitment program is learning and getting better at targeting your audience.
Again, I am not saying that CPI alone is a good recruitment metric. There are dozens of data points that can help characterize your campaign and provide useful insights about how to improve it.
But you’re busy! And a good way to quickly zero in on the campaign’s health is to ask two questions about the CPI:
How does the current CPI compare to the original funnel projection?
How is the CPI trending over time?
That’s a solid hack to get you going.
In my day job, the main “dashboard “I helped design is actually 12 dashboards stitched together – and even then I often find myself doing extra analyses on the side.
Mathematically, BMI is the assumption that humans are perfect cylinders of water. And still it kind of works!