
Silly Vendor Math
Part 1: Time Saved

Two things that recruitment vendors tend to learn about sponsor teams pretty quickly:
First: decision makers absolutely love a good case study. You’d think, they’re data people - they aren’t going to want to see anecdotes, but nope. “Let me tell you a story about the time we did this thing and it went well” is a study manager’s siren song.
Vendors are of course happy to oblige. Sometimes it seems as if every project they’ve ever worked on has become a case study. This makes a lot of case studies really tough to interpret – if you’ve ever been confused by one, it’s almost certainly because the vendor’s worked really hard to find some positive data points, even for their least successful programs.
Second: many ClinOps people are allergic to the words “acceleration” and “speed” when talking about recruitment. I think mainly because it smells like risk, pressure, and quality issues.
There’s an easy fix for that: vendors have mostly rebranded “acceleration” as “time saved”. That doesn’t sound like risk – it sounds like efficiency! I don’t want to hurry, but I could sure use some extra time.
Of course, mathematically they’re the same thing. If you accelerate enrollment to get to LPI in 12 months instead of 15, you have “saved” 3 months. This is the same trick as labeling your 20% fat ground beef as 80% lean. I don’t know why it works, but it definitely works for a lot of people.
So, it’s not surprising that you get a lot of case studies that show a trial’s time saved by using a central recruitment program. Measuring this turns out to be a little tricky, so it’s worth walking through an example.
Let’s walk through an example, pulled from a vendor website1:
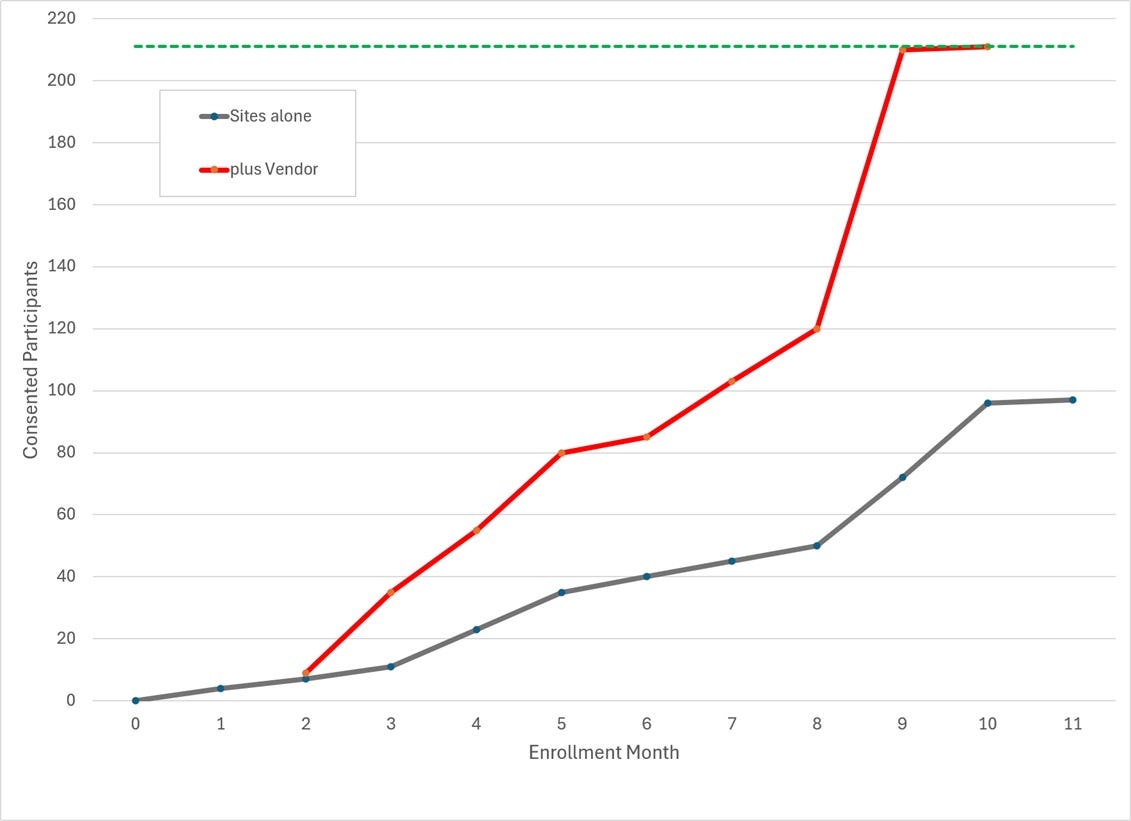
The first thing to notice is that this does in fact seem like a pretty good campaign! The vendor takes credit for over half the total consented participants. So far so good.
But how do you extrapolate a “time saved” ROI for this? You want to calculate what the sites would have done on their own, without the campaign.
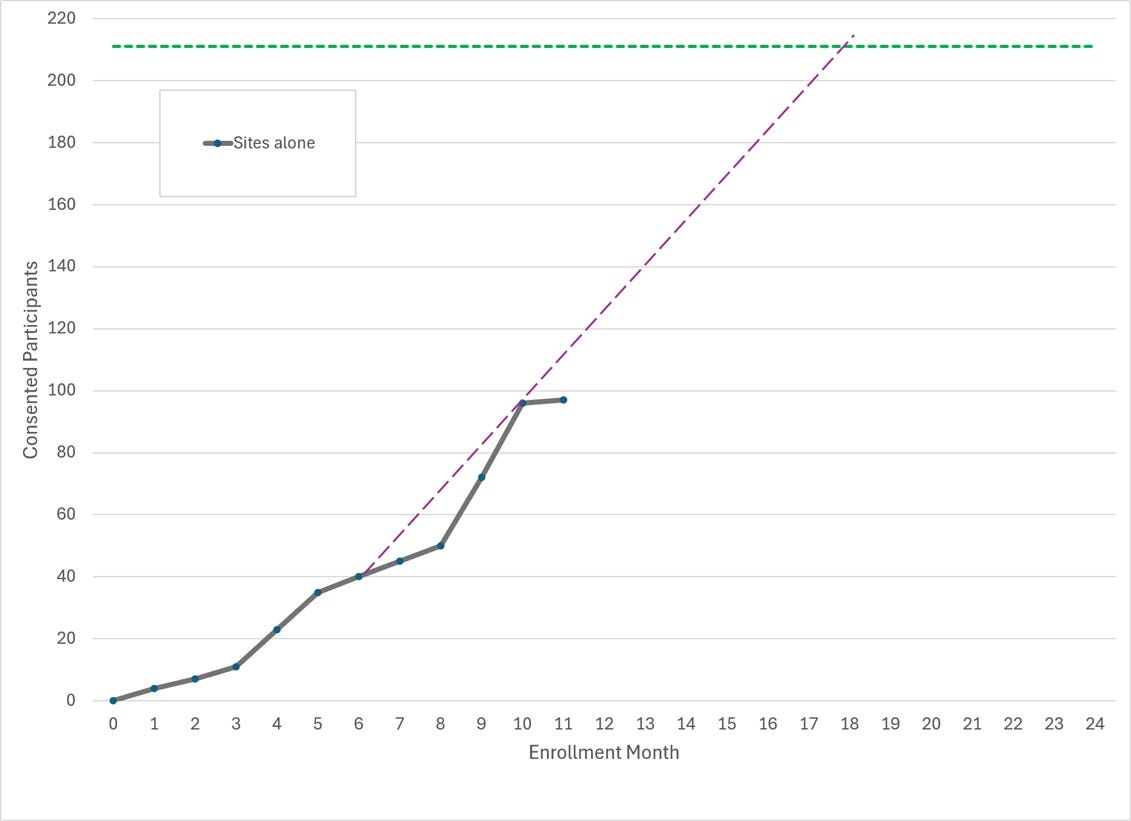
The simplest – and also very wrong – method is to take the total enrolled over the total time and use that as an average. This is exactly what they did. Visually, this is the same as drawing a line between the first and last points on the site enrollment scale, and looks like this:
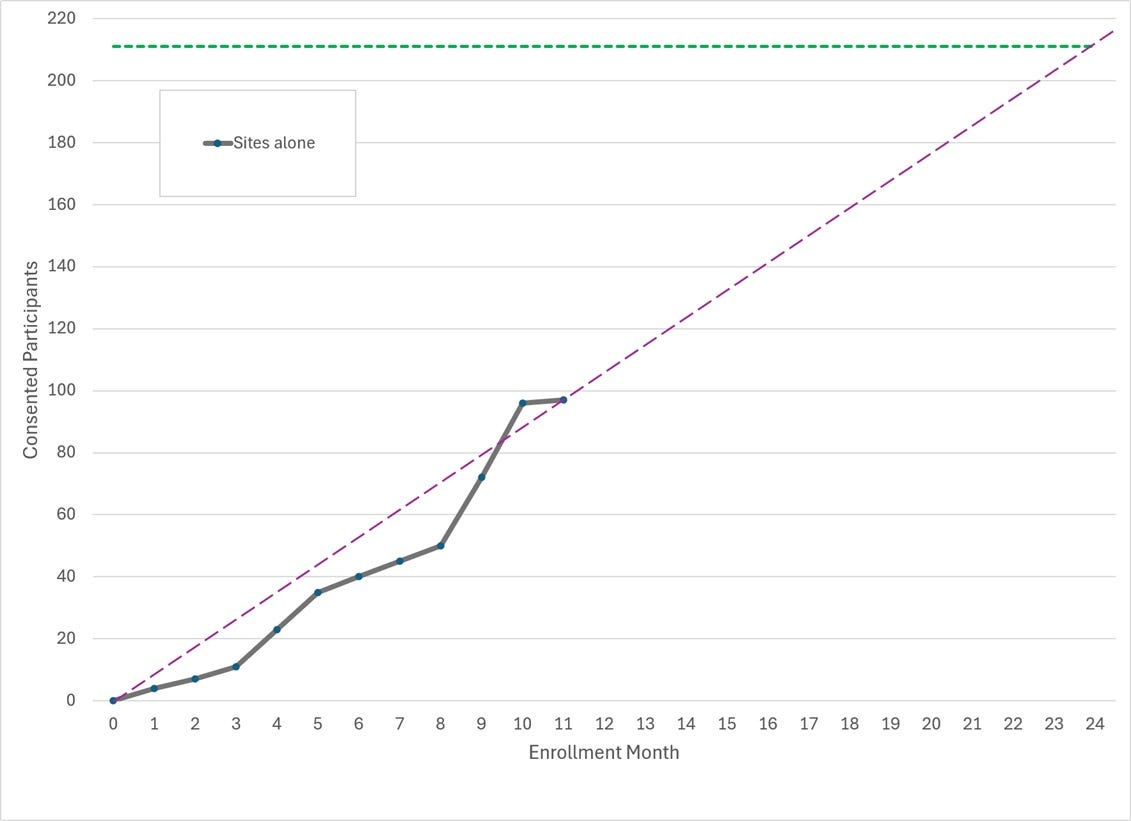
And boom! 13 months of trial time saved. And that’s the claim in the case study.
(Actually, the case study claims 14 months for some reason. It looks like their projection slowed down in the last few months to stretch out the final completion time. But it’s very close to the above.)
But this is a bad analysis. We cannot know for sure what the sites would have done, but we can be pretty confident that this isn’t a fair picture.
Most trials enroll slowly at the start and pick up speed over time. This may be because sites get better at enrolling after a while – but it’s also because there just aren’t that many active sites at the beginning.
In this case, it’s pretty glaring. In the first two months of enrollment, the sites consented about 4% of the trial goal. In the last two months before they stopped, they consented somewhere close to 25% of the goal.
Which of those numbers is more likely to reflect their performance if they had kept going?
If they had maintained that final pace, the trial would have wrapped up in ~4 months. (I am ignoring the 1-patient month at the end, since this was clearly not a full month of enrollment and shouldn’t have been used in any projection.)
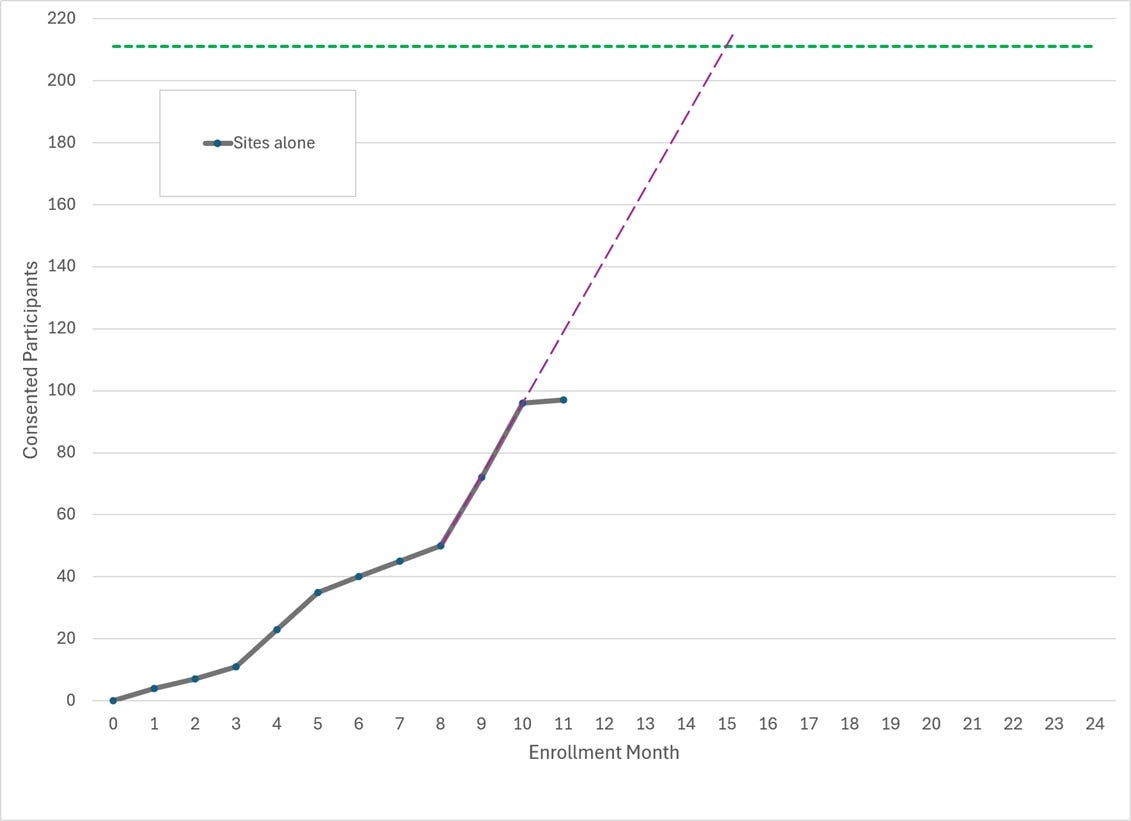
A more site-unfriendly projection might push that up to 6-7 months. Which isn’t bad! But it also most certainly is not 14 months.
The big takeaway
The key thing I’d want buying teams to learn when hiring recruitment vendors is: Don’t ask for case studies. Please, anecdotes are not for important buying decisions!
But we all know that’s not going to happen, so here we are. Instead I would say:
Time saved is a weird metric that will always look good for the vendor. Even if you only enroll one patient, you’ve technically saved time on the trial
If a vendor shows you a time saved case study, ask them to walk you through how their projection works. See if they understand how enrollment should be modeled.
In the worst case: if you can’t trust their math, why would you trust their reporting in the first place? At a minimum, you will need to dedicate more resources to monitoring and managing their performance during the campaign.
Data pulled from an image, so my rendering may be a patient or two off from the original but nothing that would change the analysis. Also worth noting that most case studies I looked at for this post did not provide nearly enough information to understand what happened. This one is actually better than most in that regard.